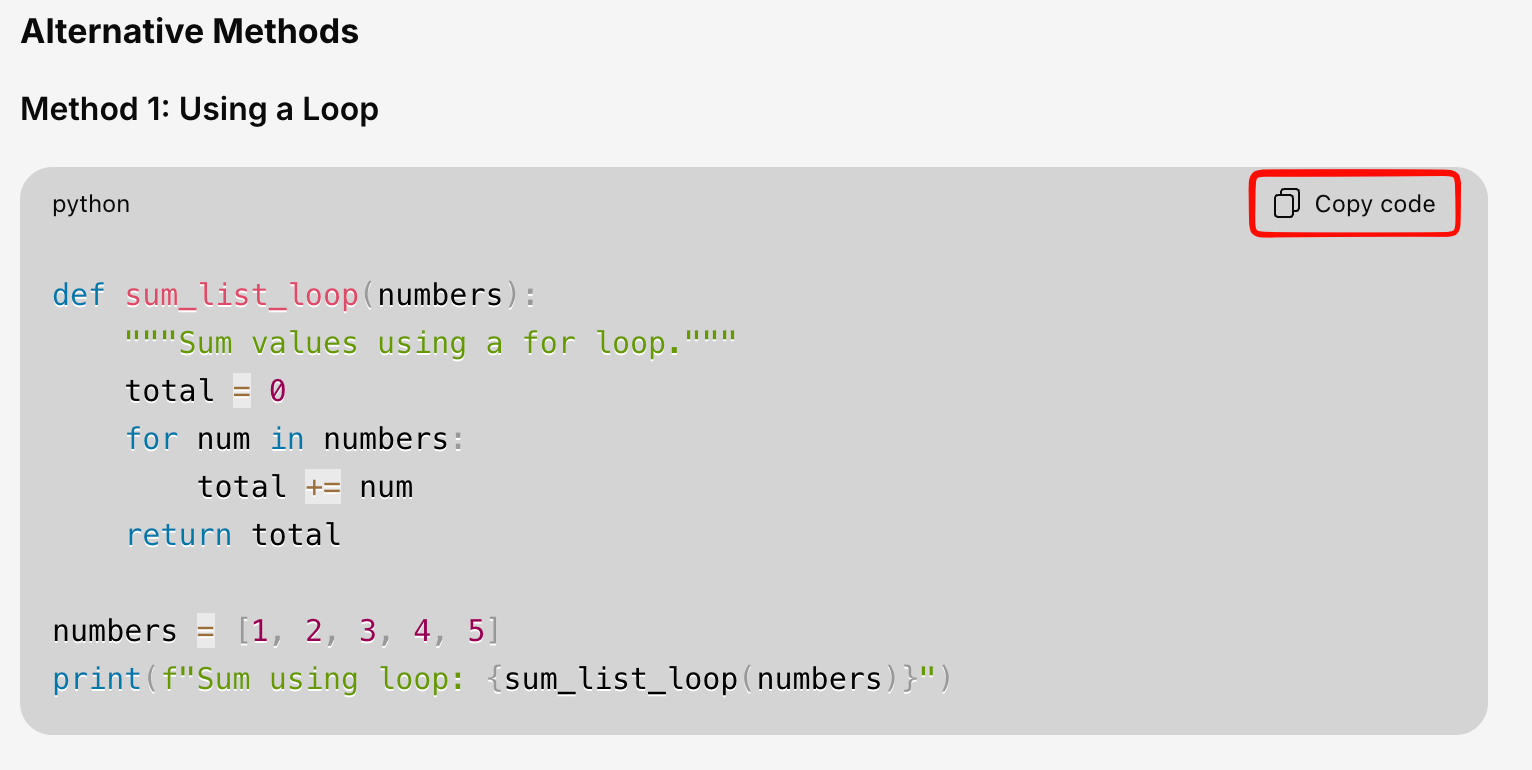
Code Blocks
When the AI includes code in a response, it’s rendered with full syntax highlighting for easy reading. Supported languages include Python, JavaScript, SQL, HTML, CSS, and many more.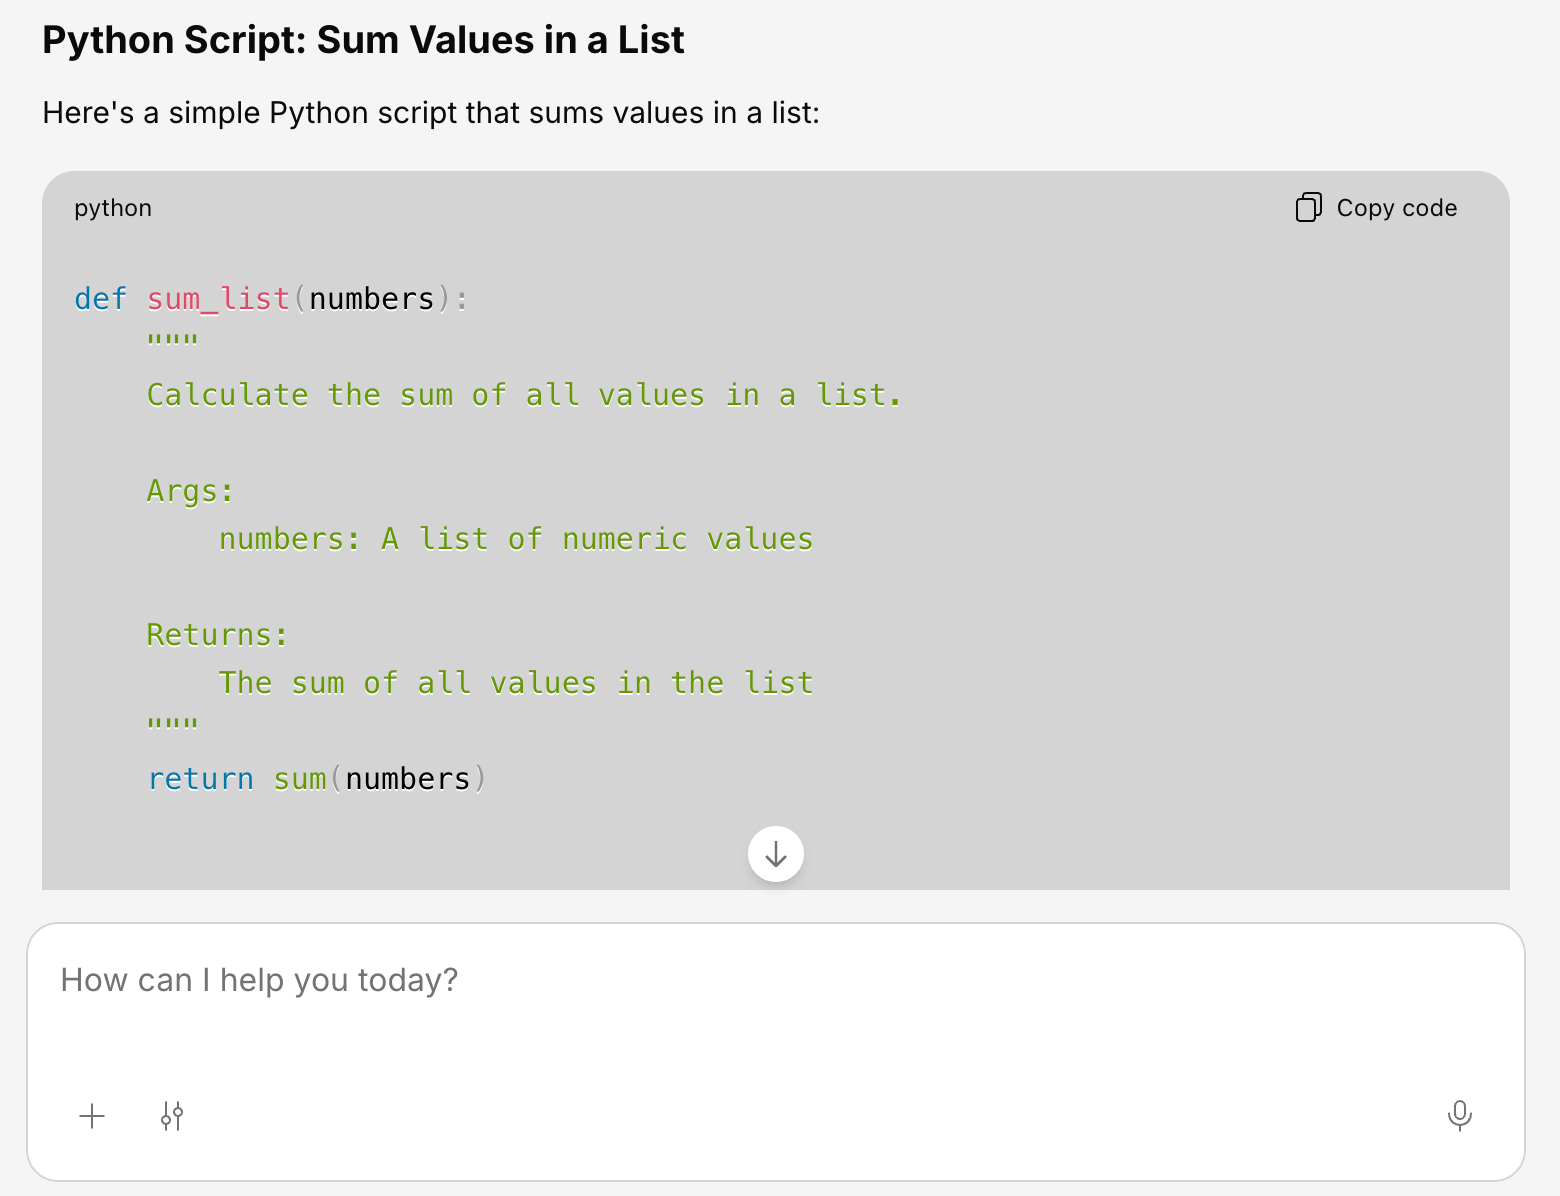
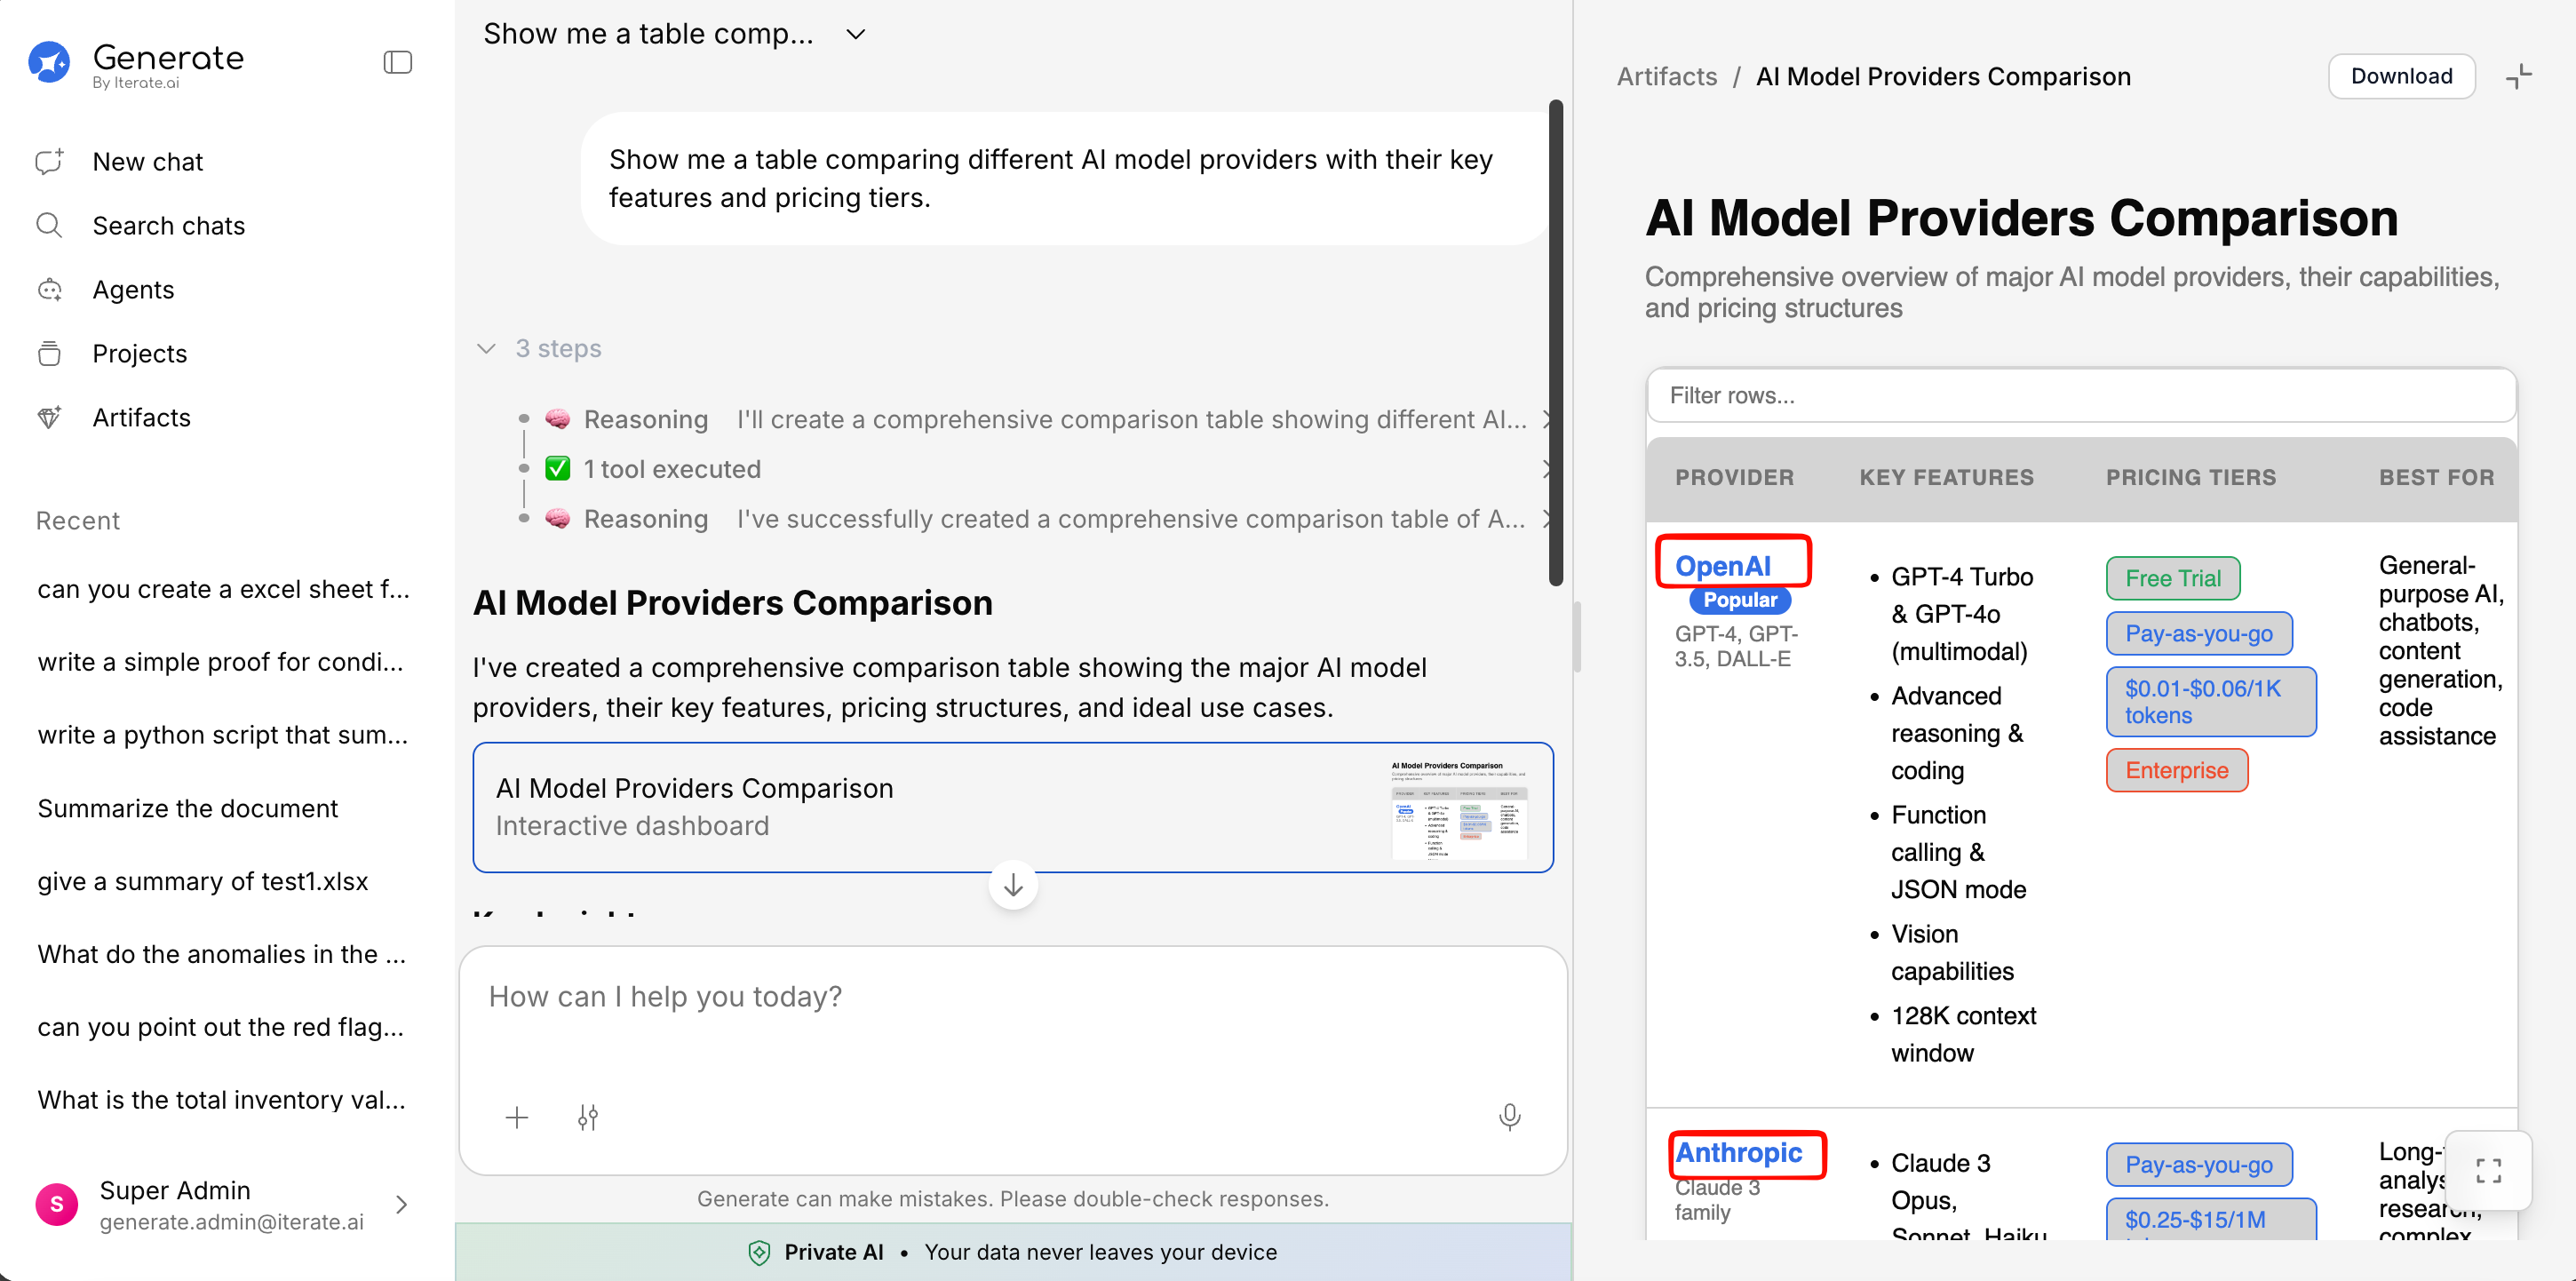
Interactive Tables
Tables in responses are fully interactive:- Sort — Click any column header to sort the data
- Search — Use the search bar above the table to filter rows
- Download — Export the table as CSV or Excel using the download button
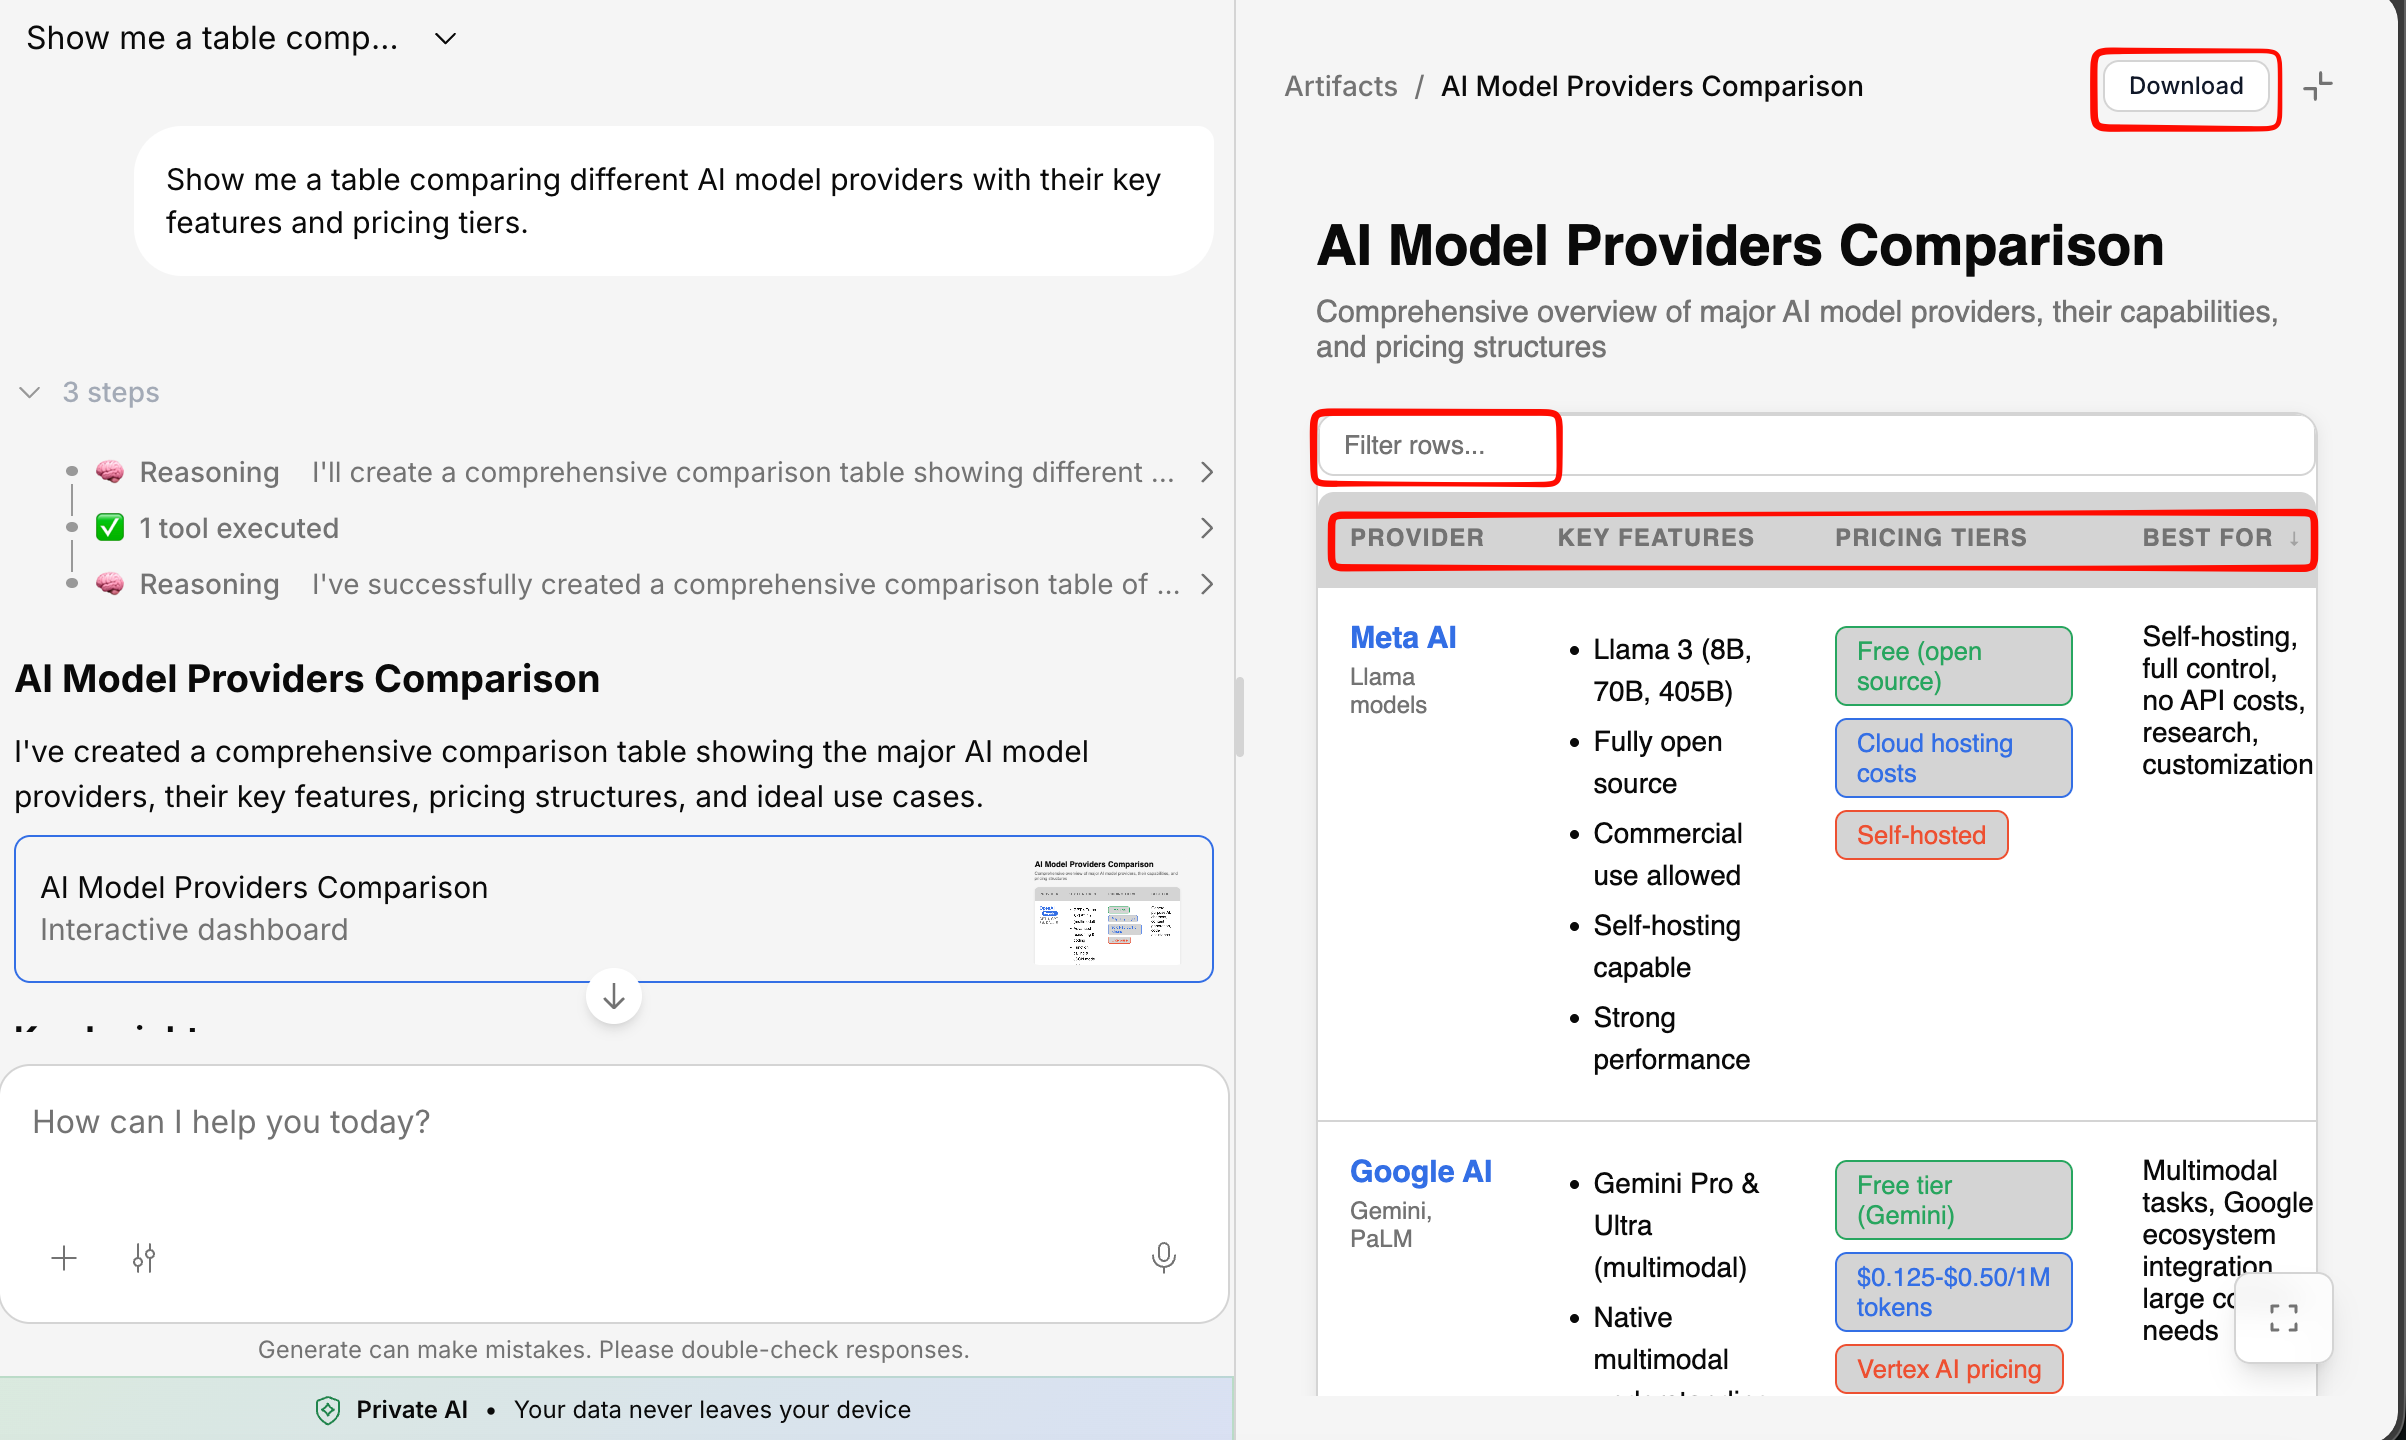
Table Export
Click the download icon on any table to export it:| Format | What you get |
|---|---|
| CSV | Comma-separated file for any spreadsheet tool |
| Excel | .xlsx file for Microsoft Excel or Google Sheets |
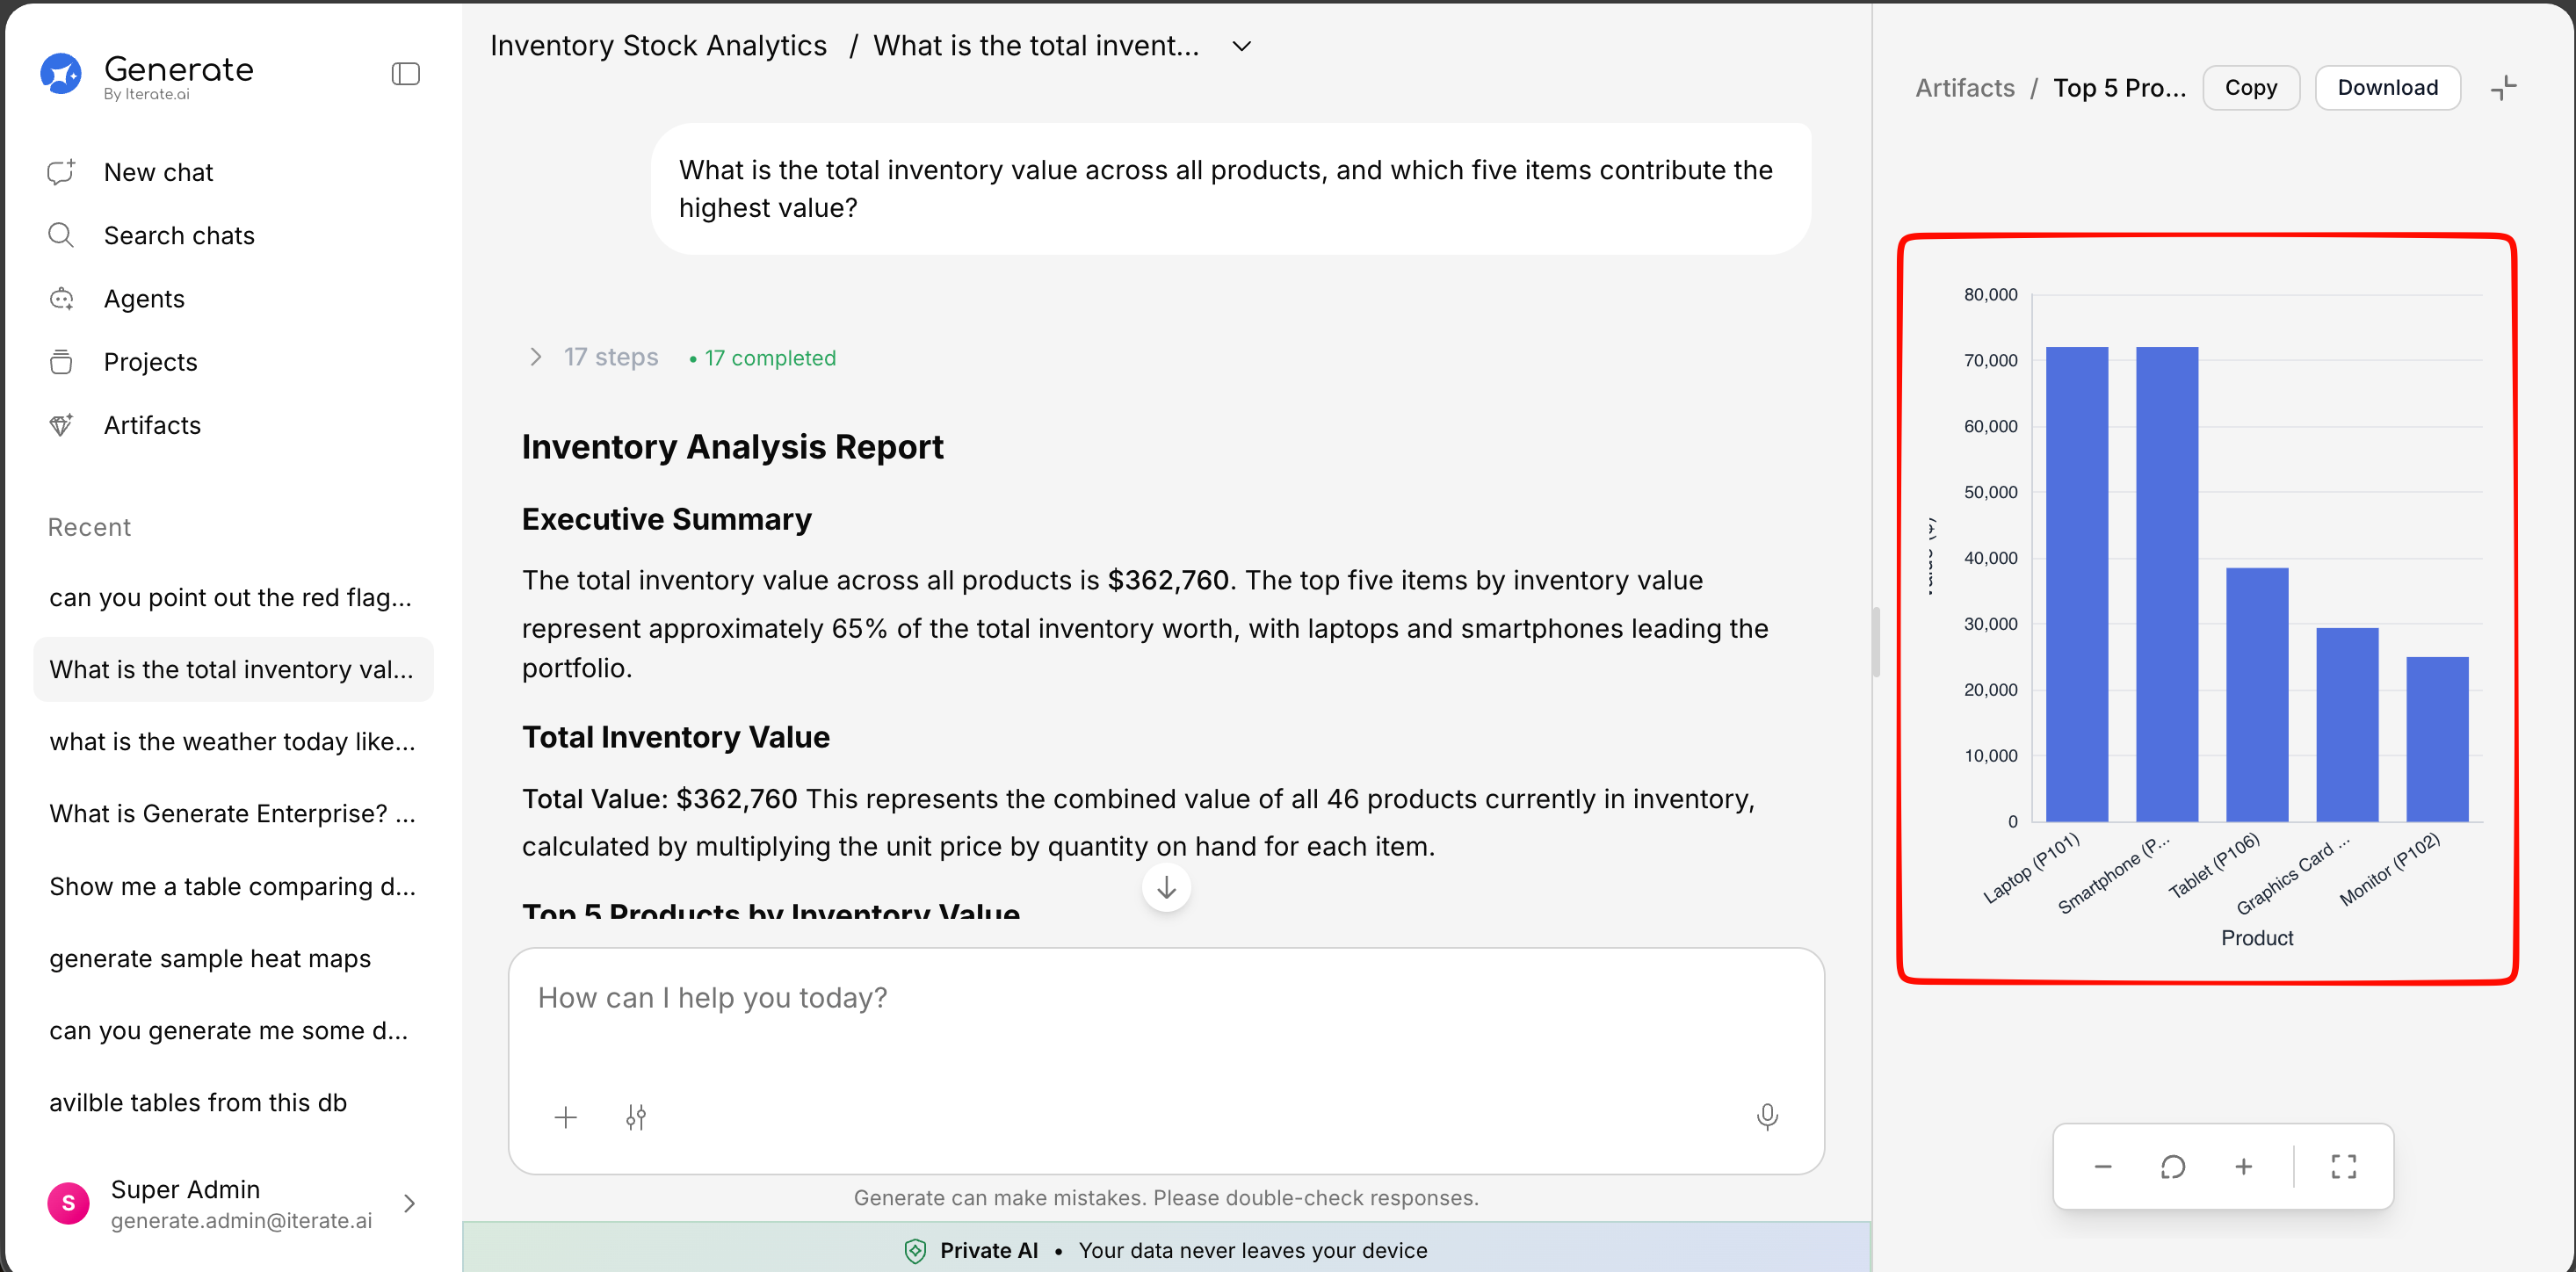
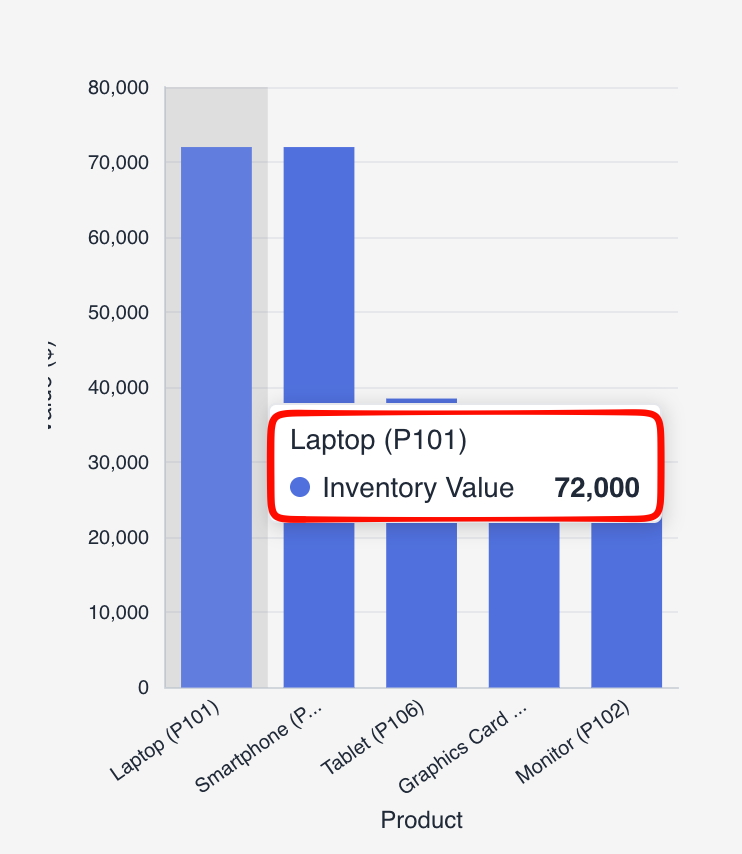
Data Visualizations & Charts
When the AI works with numerical data, it can render inline charts and graphs directly in the response. Supported chart types include:Bar Charts
Line Charts
Pie Charts
Scatter Plots
Gauge Charts
Treemaps
Sunburst
Funnel Charts
Radar Charts
Heatmaps
Images
The AI can display images inline within responses. Click on any image to view it in full size.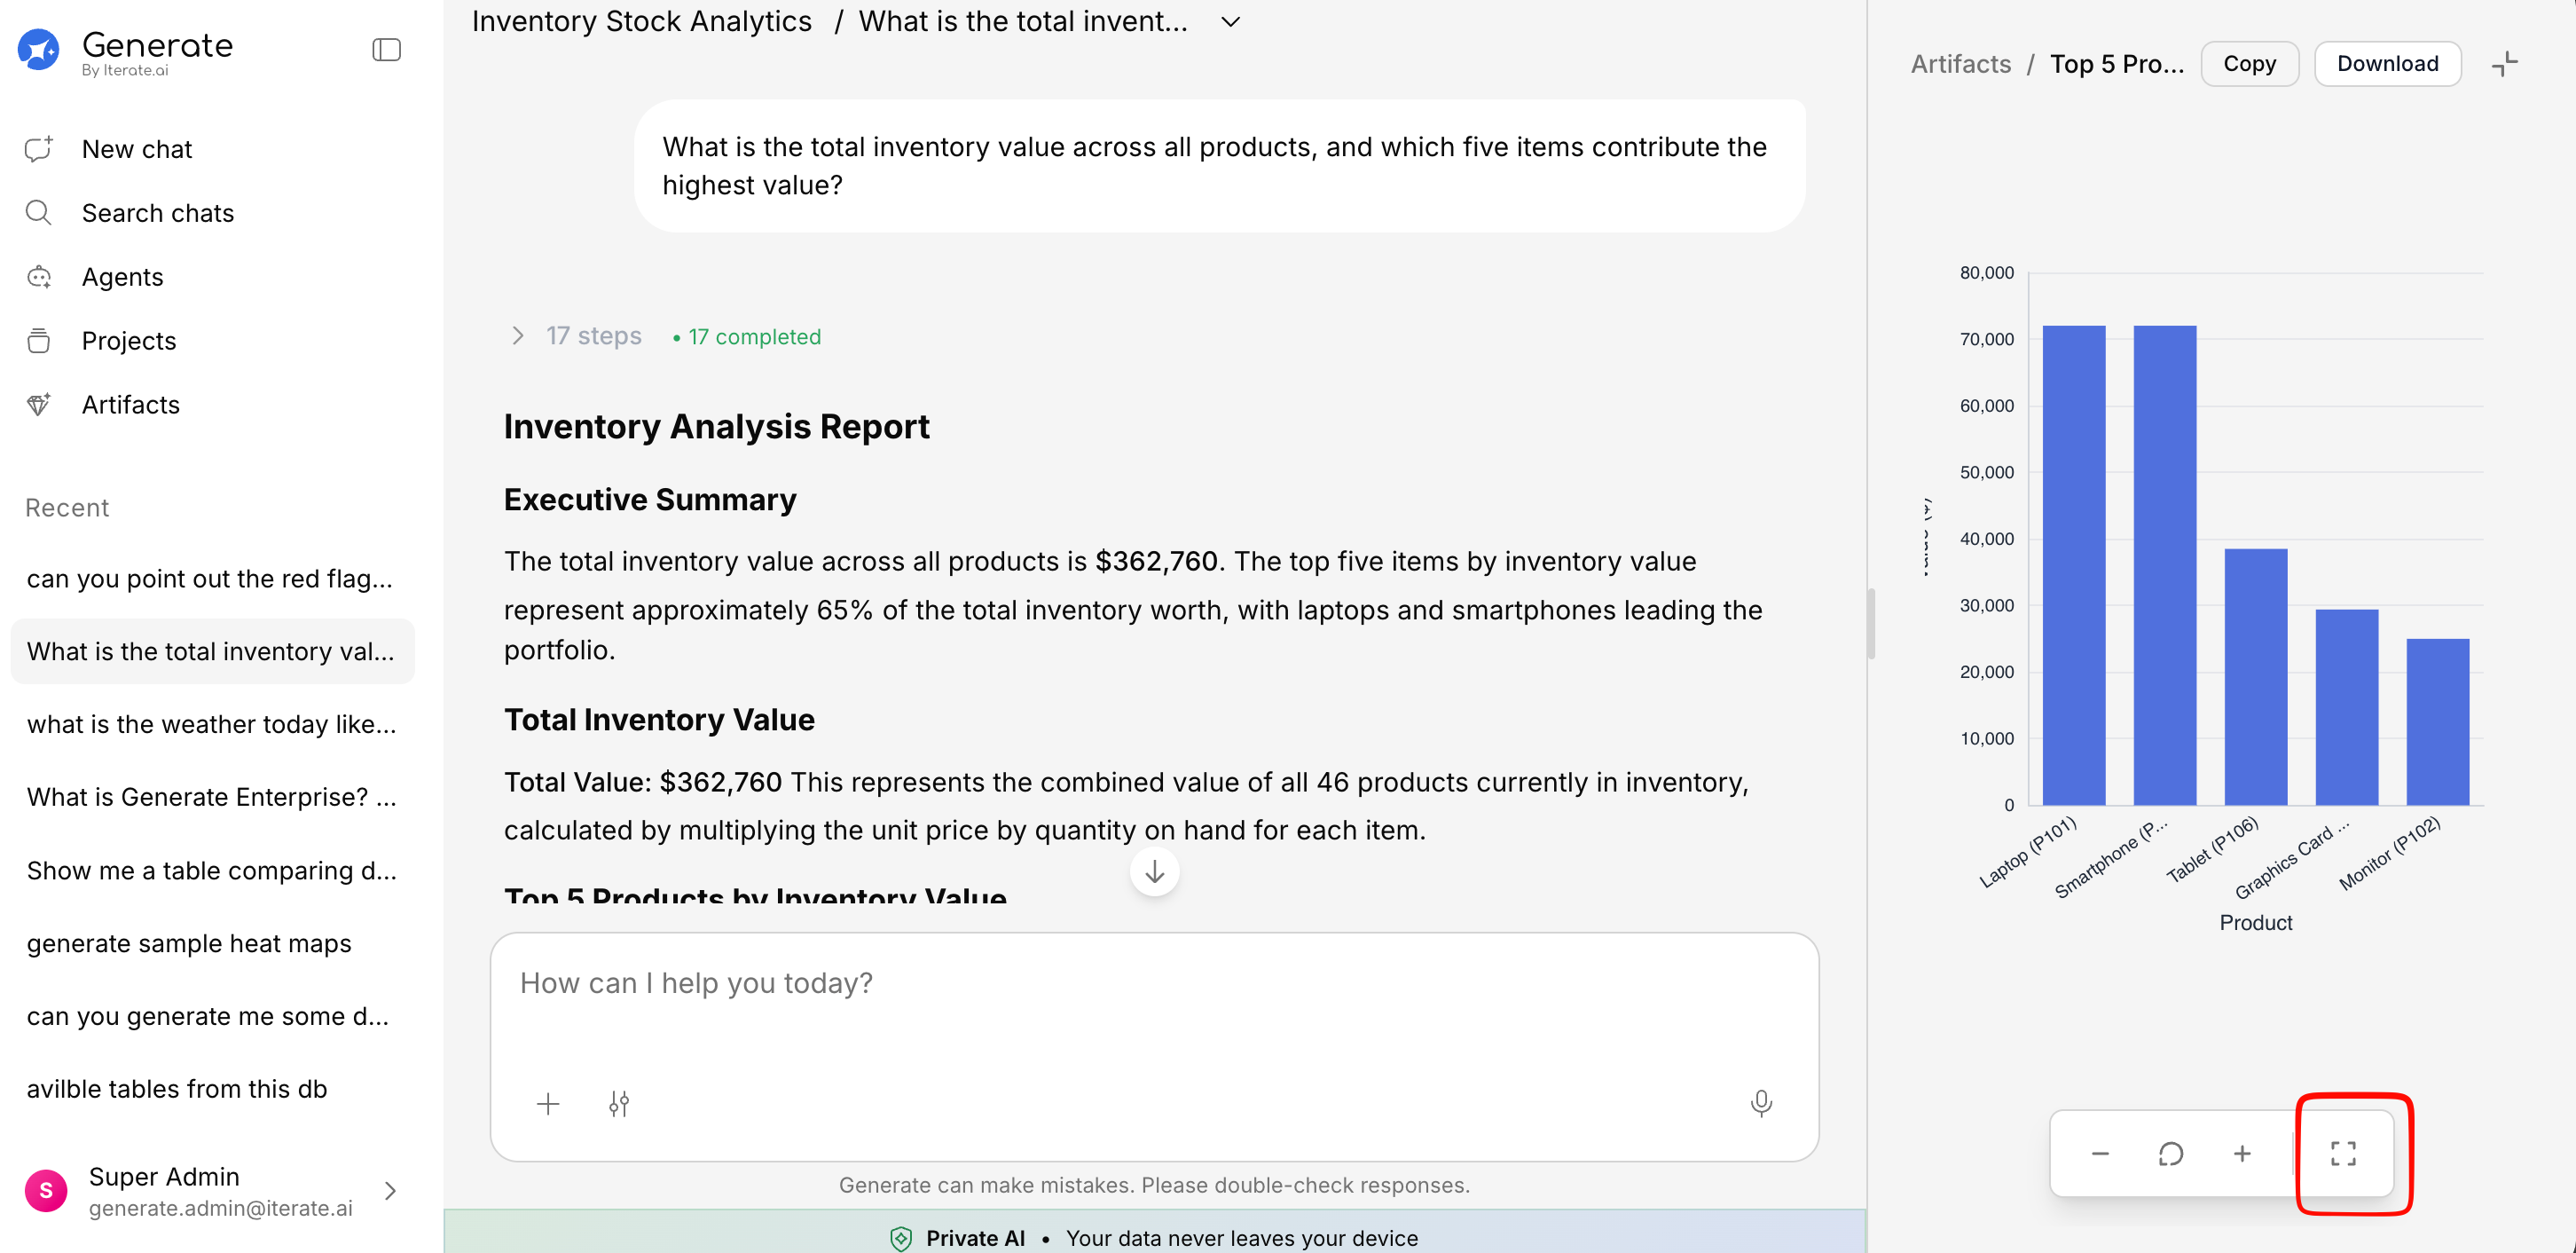
Mathematical Formulas (LaTeX)
Generate supports rendering mathematical expressions using LaTeX notation. Formulas are rendered beautifully inline or as block equations.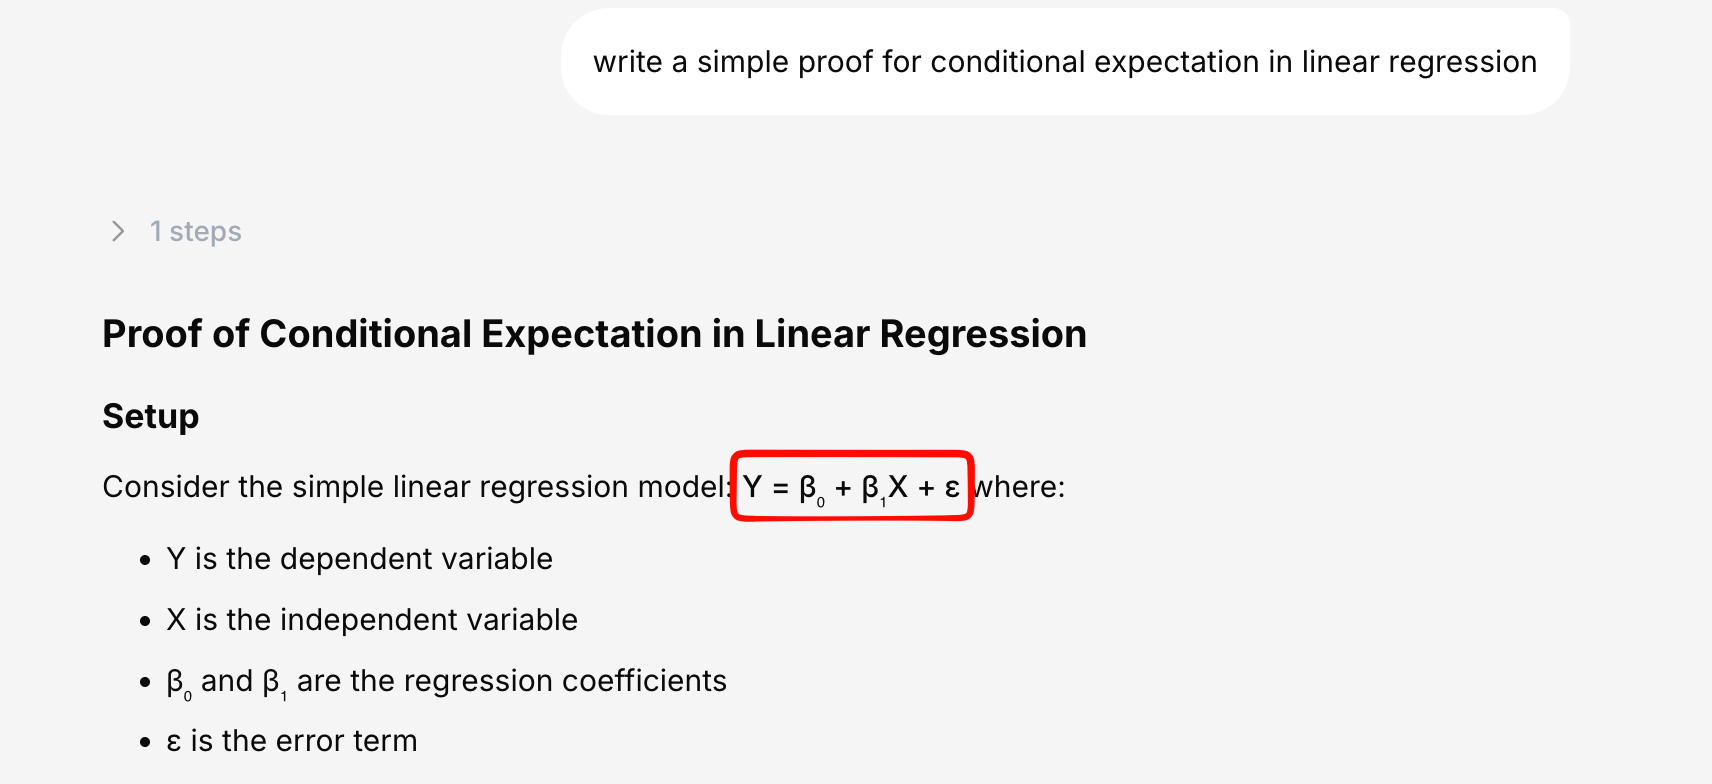
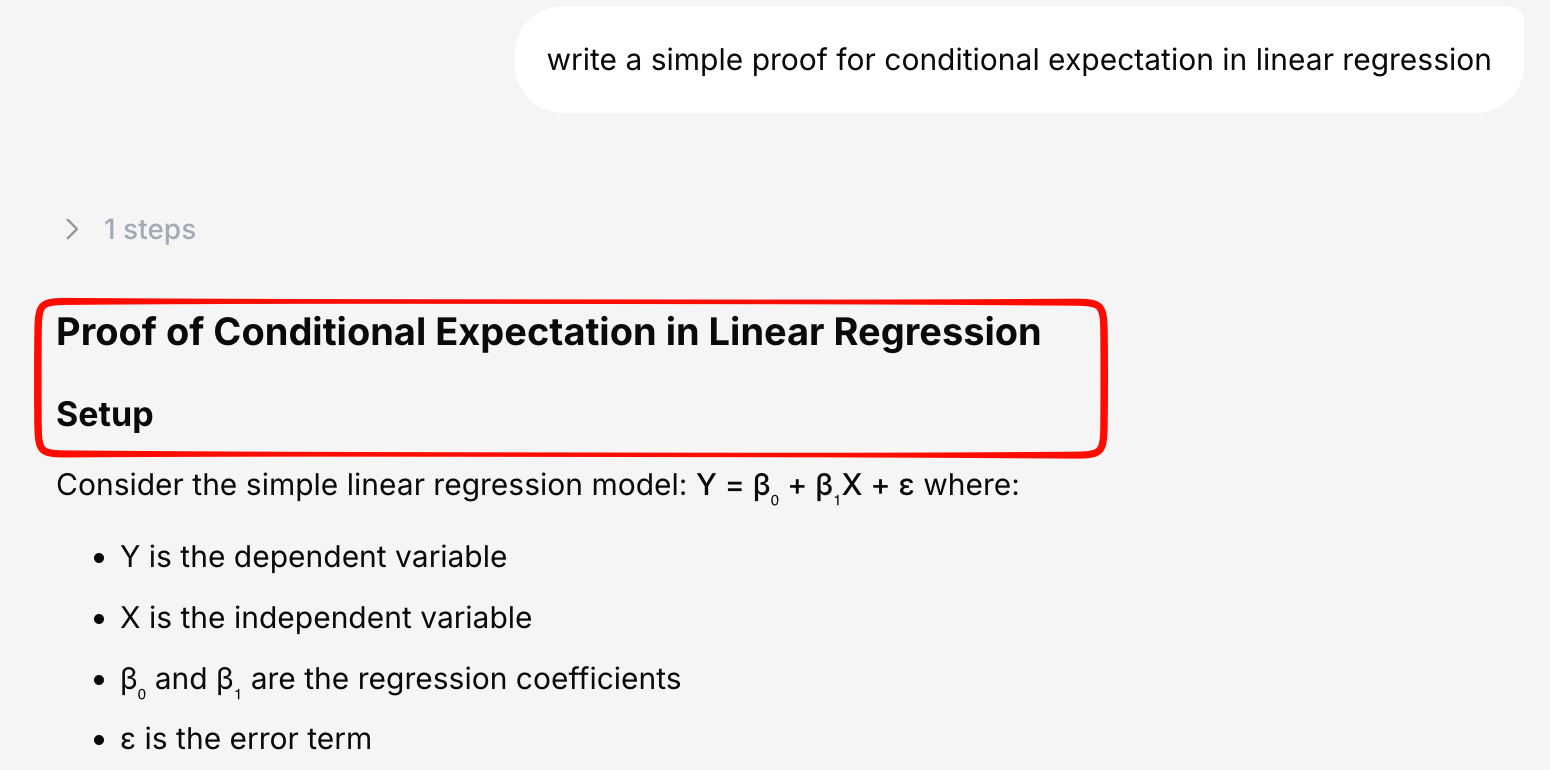
Markdown Formatting
All responses support full GitHub-Flavored Markdown:- Headings (H1 through H6)
- Bold, italic, and
strikethroughtext - Bullet lists and numbered lists
- Blockquotes
- Horizontal rules
- Nested content
- Links and URLs
Row-Highlighted Citations
When a response references specific rows from a database table, those rows are highlighted in the table view so you can see exactly which data the AI used.